Product Details
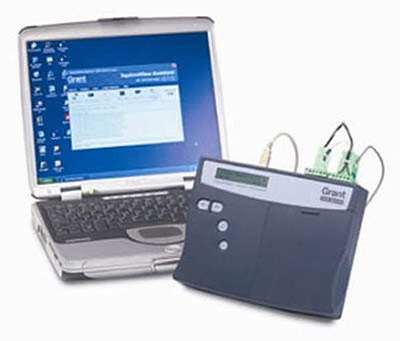
SquirrelView Plus data logger software allows quick and easy analysis of the Squirrel data in a familiar Explorer navigation-style interface. It has all the features of SquirrelView with the additional benefits of allowing graphical analysis of historical and on-line data, whilst providing advanced reporting options.
Data can be displayed with two different auto scaling Y-axes ─ essential for displaying widely varying data from different sensors on one graph. Particular data of interest can be zoomed into whilst an on-screen cursor can pick out exact values. Data can be shown in a statistical summary with set high and low alarm thresholds. The powerful calculation function allows the creation of “virtual” new channels from existing channels e.g. value from channel 1 added to the average of 10 readings from channel 2 etc.
SquirrelView Plus data logger software also incorporates a flexible report generation facility which allows the creation of custom reports consisting of a title page with descriptive text, headers and footers, graphs, tabular lists of data, statistics and Squirrel logger set-up information. These can be saved as templates with any of these combinations saving time when preparing similar presentations of data.
Key features
- Flexible data presentation allows you to quickly display and analyse real time or historical data as a line graph, bar chart or analogue gauge
- Graphical alarm and event identification lets you easily identify occurrences around specific analogue or digital events, e.g. a pump switching on
- Quick Graph function lets you quickly and easily view large data files
- Wizards for easy set-up of communications and data export
- Ability to send real time metered data from the Squirrel directly into Excel
- Downloader for automating data download using MS Scheduler® (Squirrel 2010, 2020 and 2040 only).
- Fully configurable data views
- Flexible zoom feature including X and Y axes
- Customisable report facility: print out graphs, readings, etc.
- Tolerance curve
- Calculated channels
- Product cure calculation
- Display oven profiles and oven zones

